
xe/dash offers a data-driven approach to analyzing stocks, using a combination of fundamental data and quantitative analysis to provide users with a comprehensive understanding of key information.
Knowledge Graph
Uncover previously undiscovered connections with our interactive tool for tracing complex relationships. Explore and discover new insights!
Fundamental Charts
Evaluate key company metrics and compare them to past performance and the overall market to determine the validity of the company's valuation. Utilize our analysis tool to make informed decisions.
Personalized Feed
Stay informed and up-to-date with personalized, relevant information. Keep track of important events with our summary of the most crucial updates.
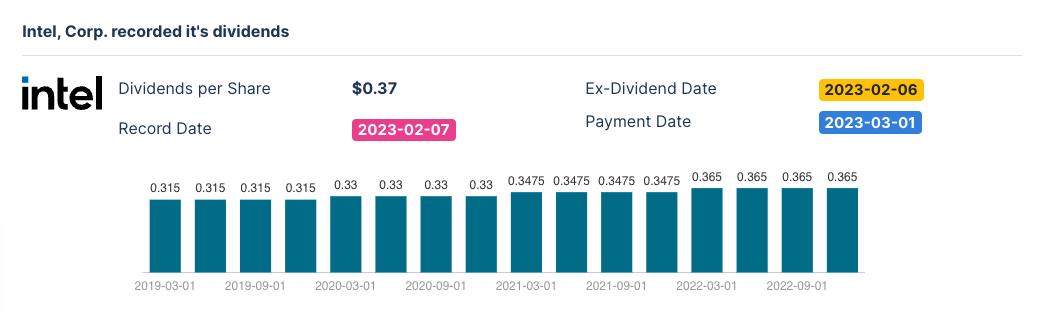
Corporate Reports
Gain valuable insights from visual representations of corporate reports. Customize your own charts to focus on the key figures that matter to you.
Experience Next-Level Investment Insights now!
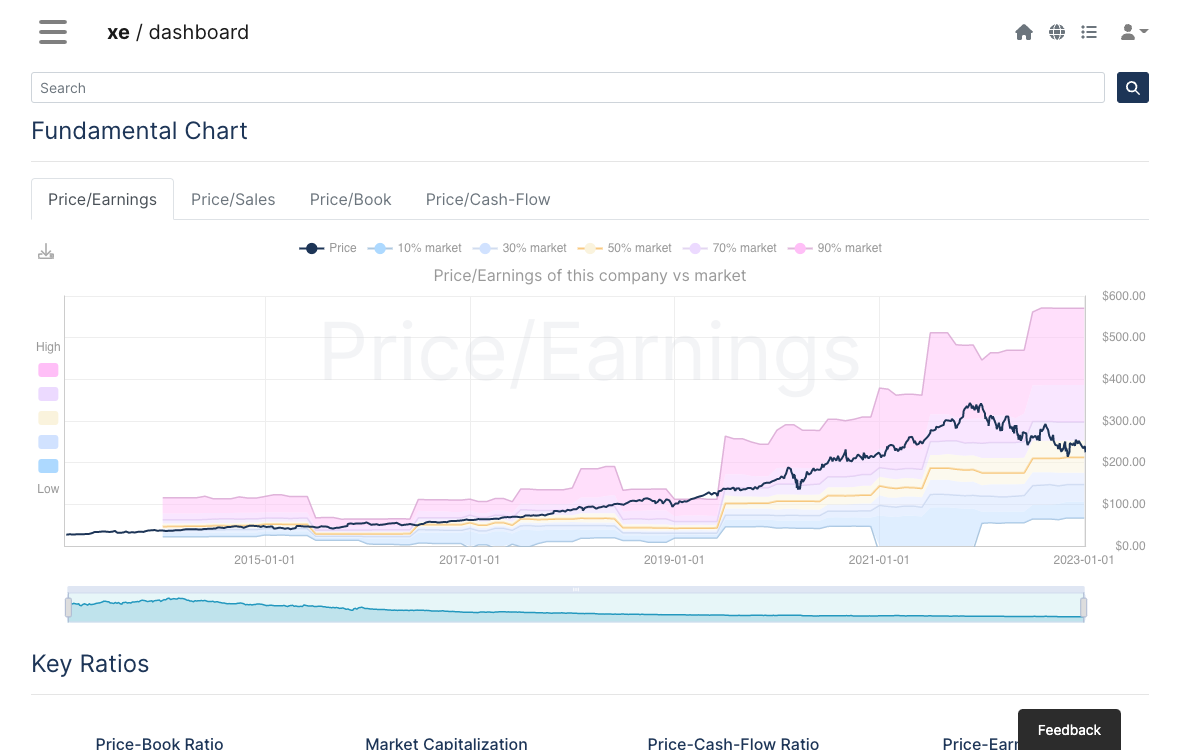
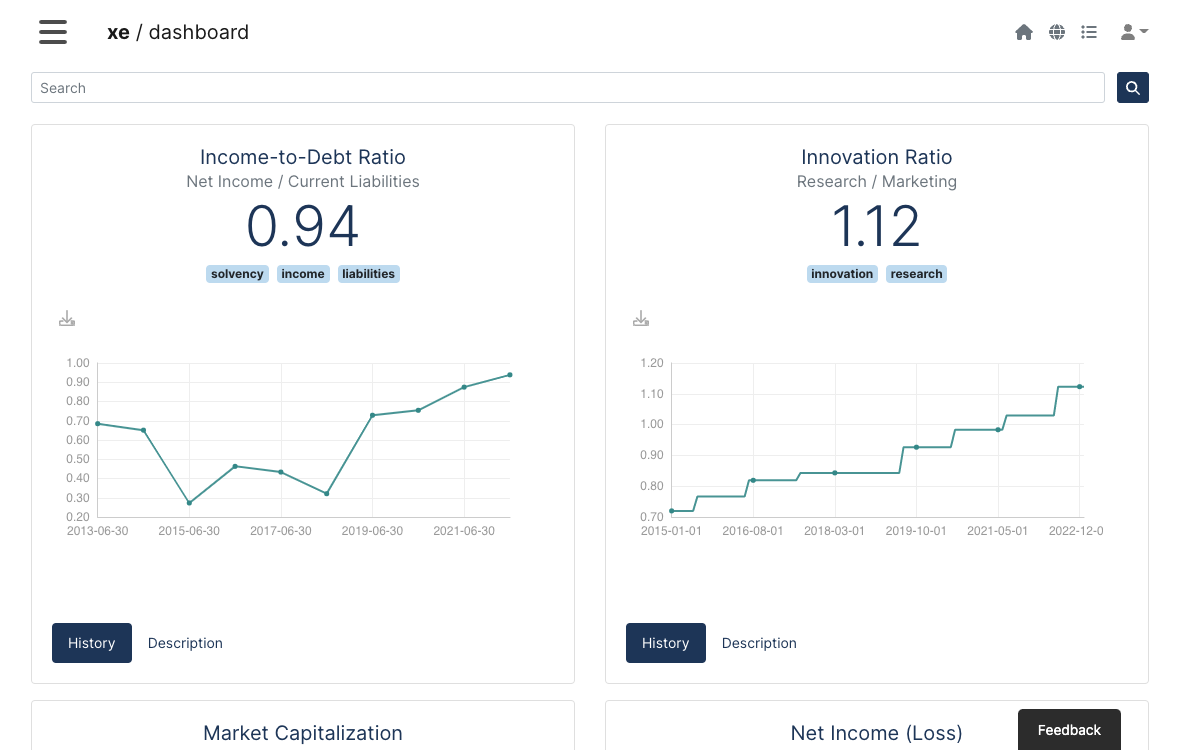
Fundamental Analysis
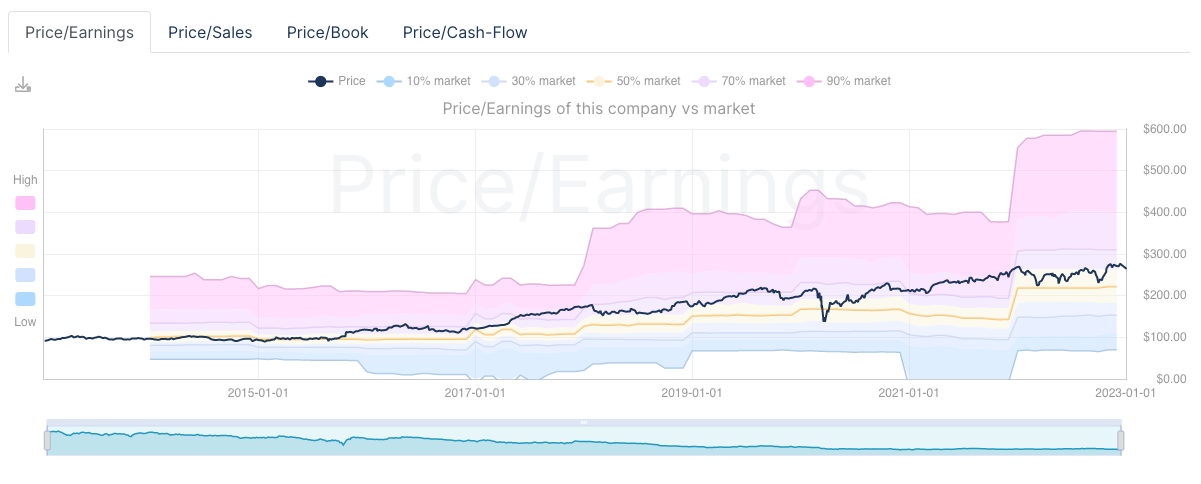
Fundamental Charts
Evaluate the share price based on key company metrics such as revenue, earnings, expenses, assets, and liabilities. Compare this data to the typical ratings of the market using fundamental charts, which display a company's financial and operational data over a specific period of time.
This information can help you determine if the stock price is justified by the company's performance and financial health. Fundamental charts can also be useful for company management as a way to track and analyze financial performance over time.
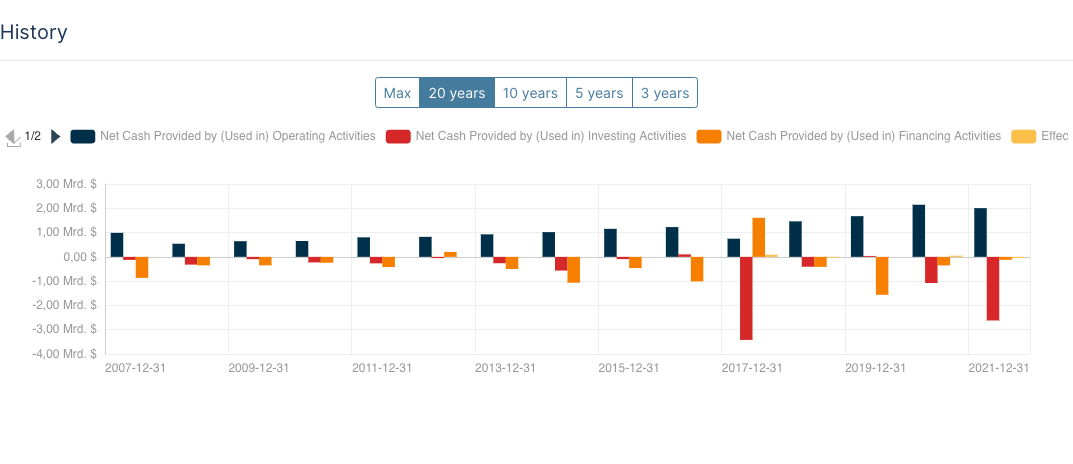
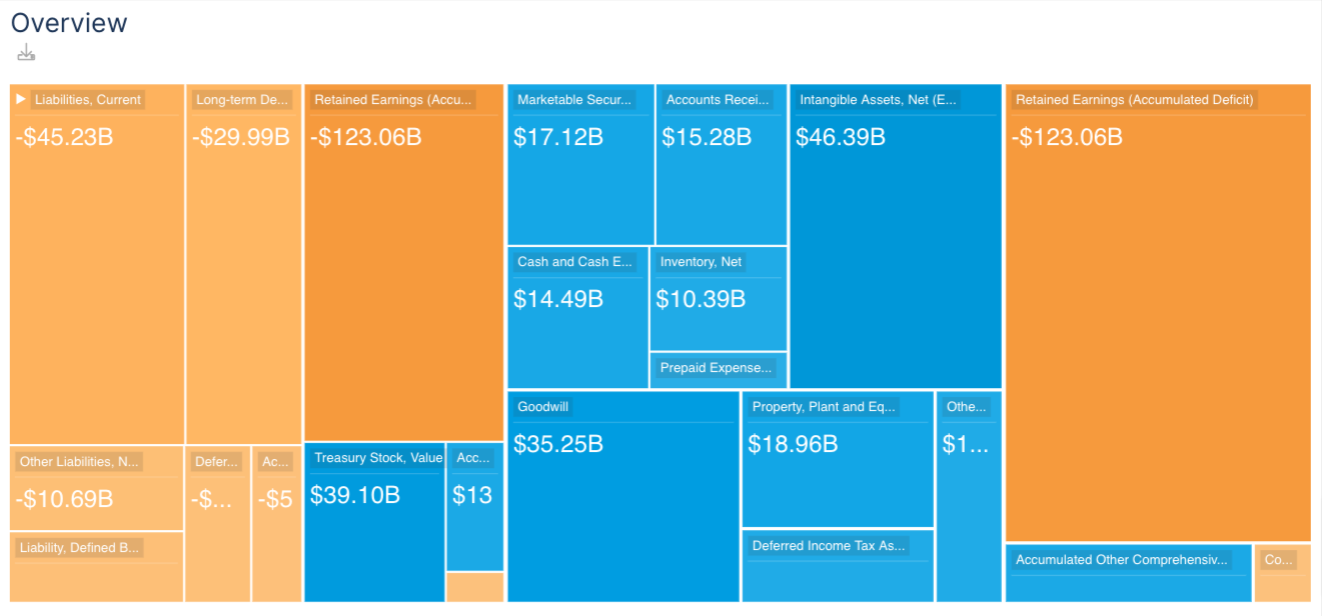
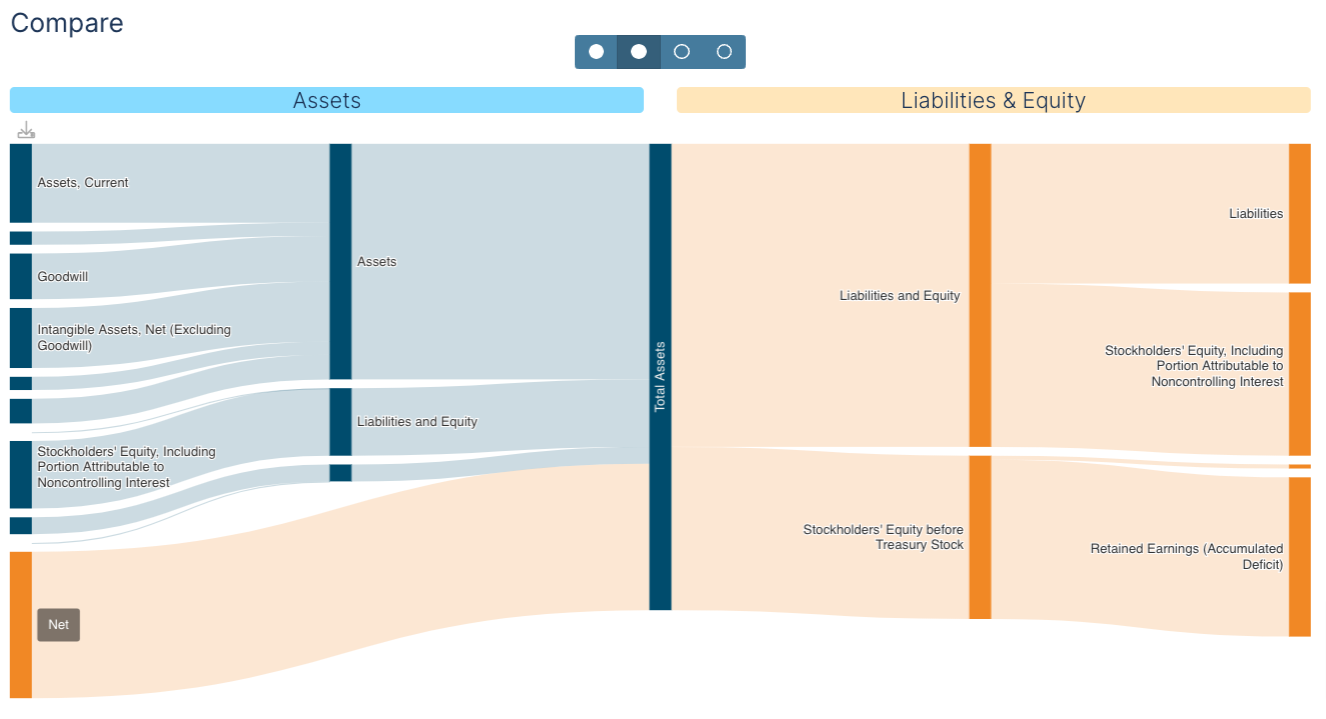
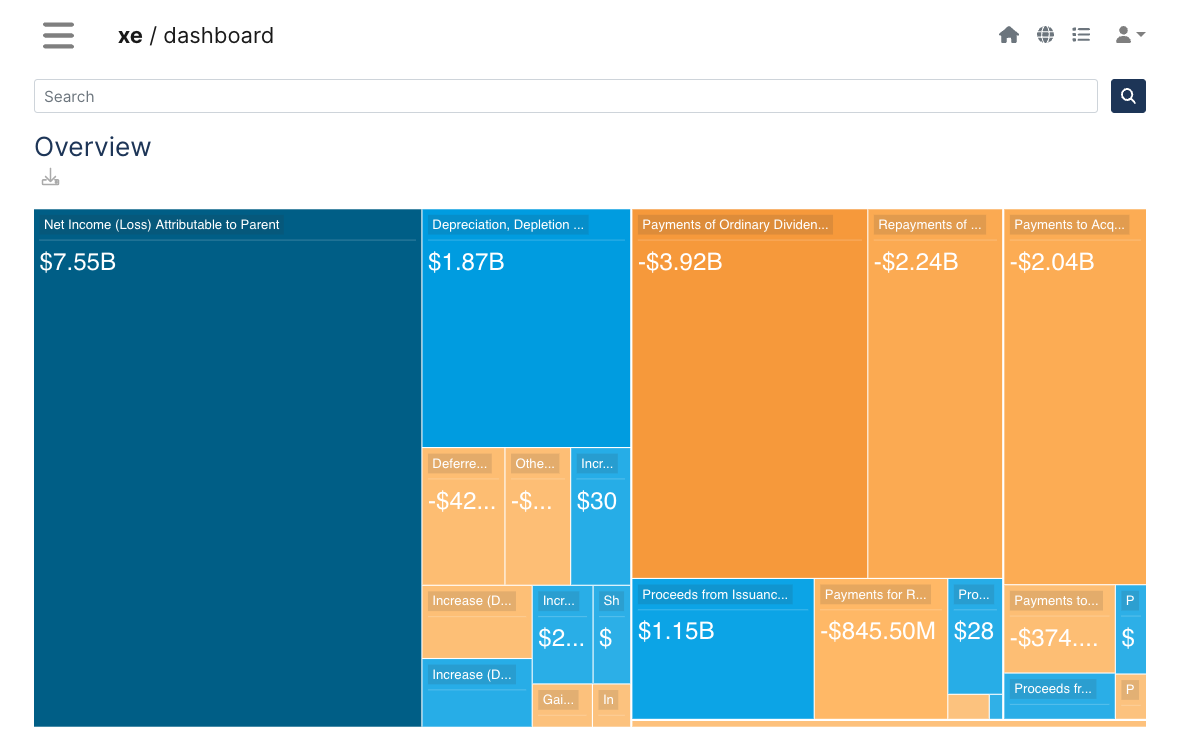
Business Figures
Quickly access relevant information with our direct processing of SEC data. Use Sankey charts to see which items make up the debit and credit side, and explore how accounting items are hierarchically composed with our tree map feature. Follow the company's progress over multiple years to stay informed and make informed decisions.
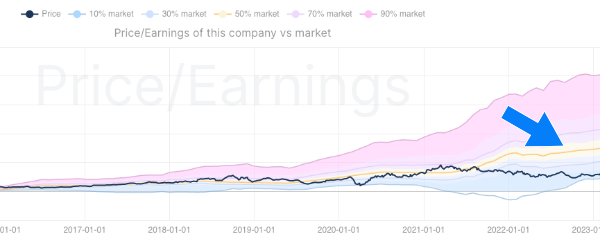
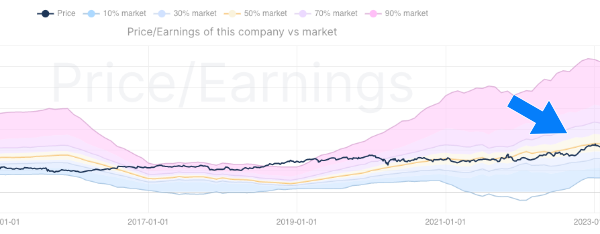
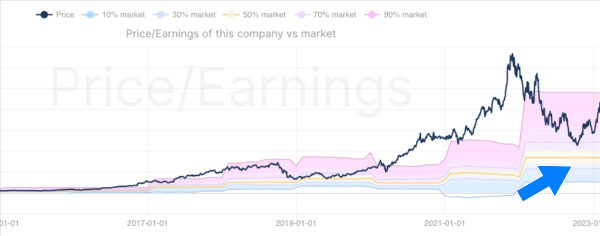
Ratios with market comparison
Compare companies using key figures with our ratio analysis tool. Go beyond simple comparisons and see how a company stacks up against its peers by analyzing the distribution of higher and lower scores. Determine if a company is above or below average with this valuable insight.
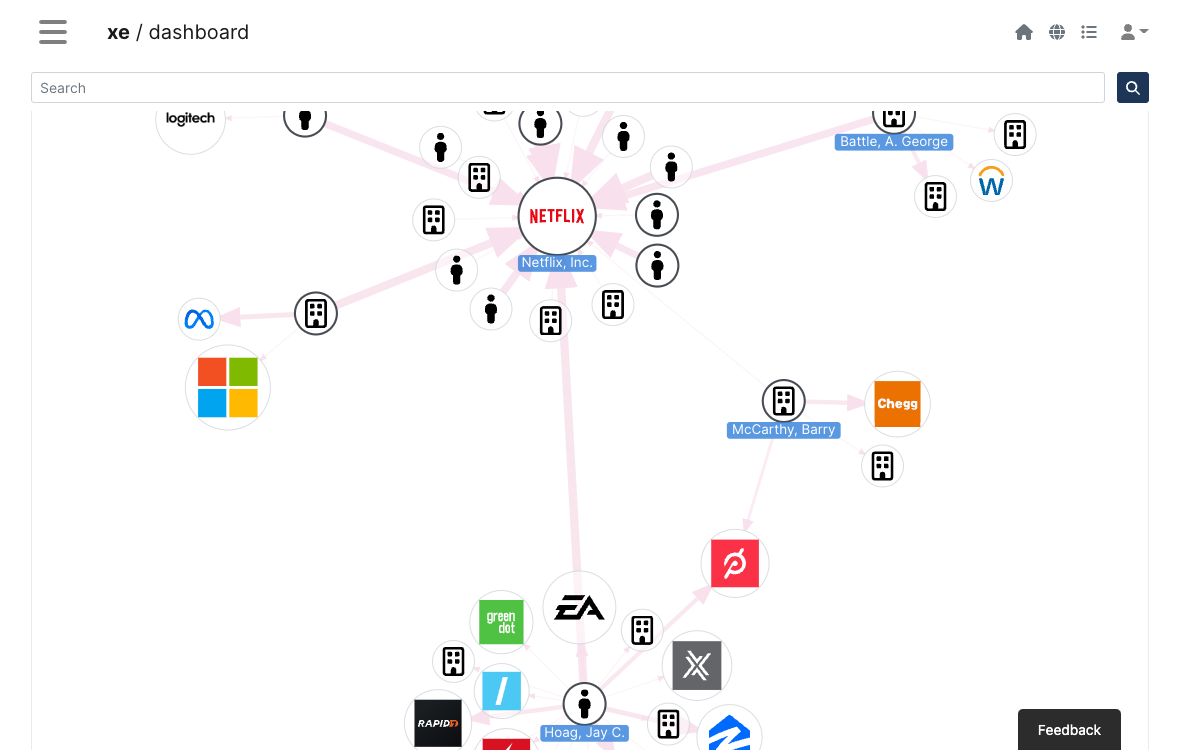
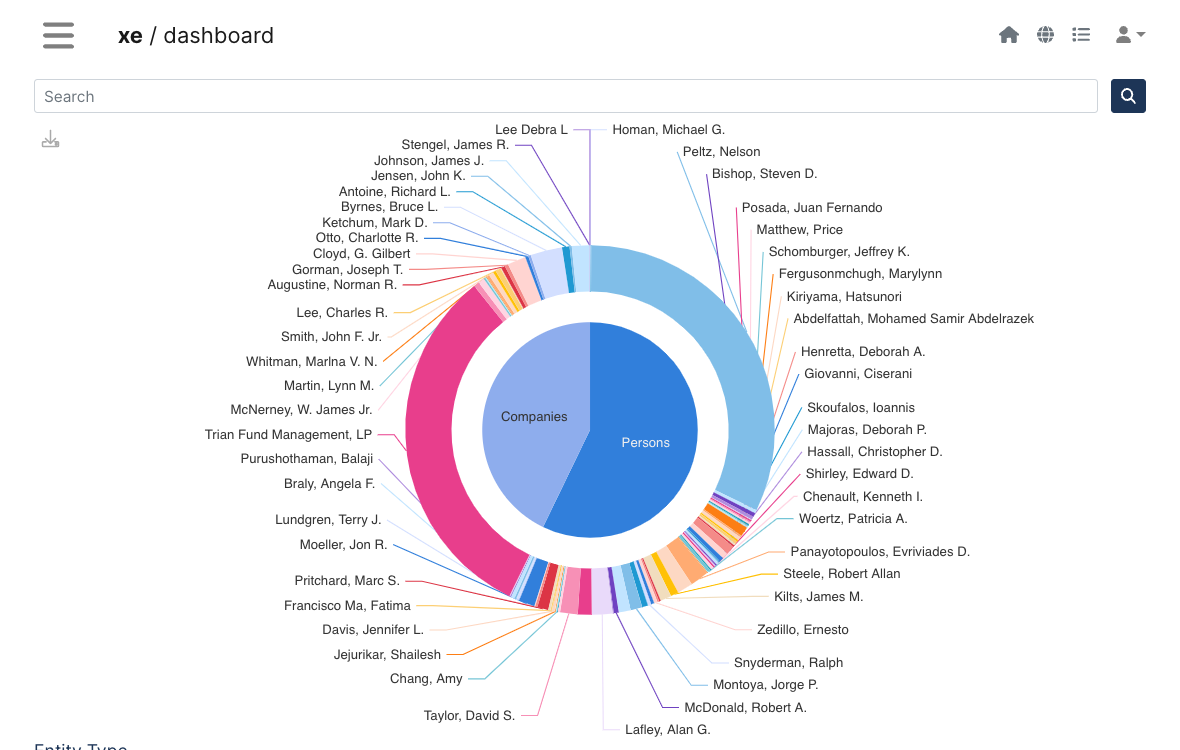
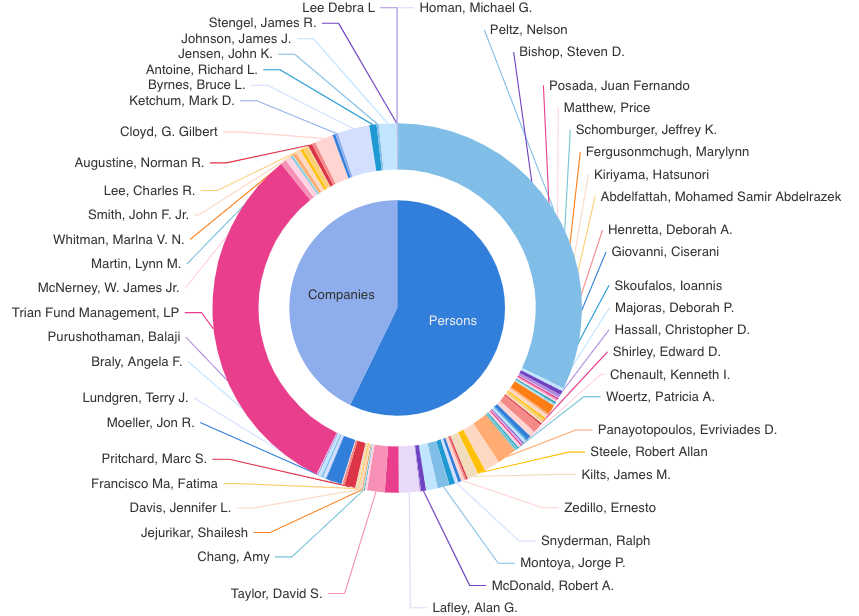
Network & Connections

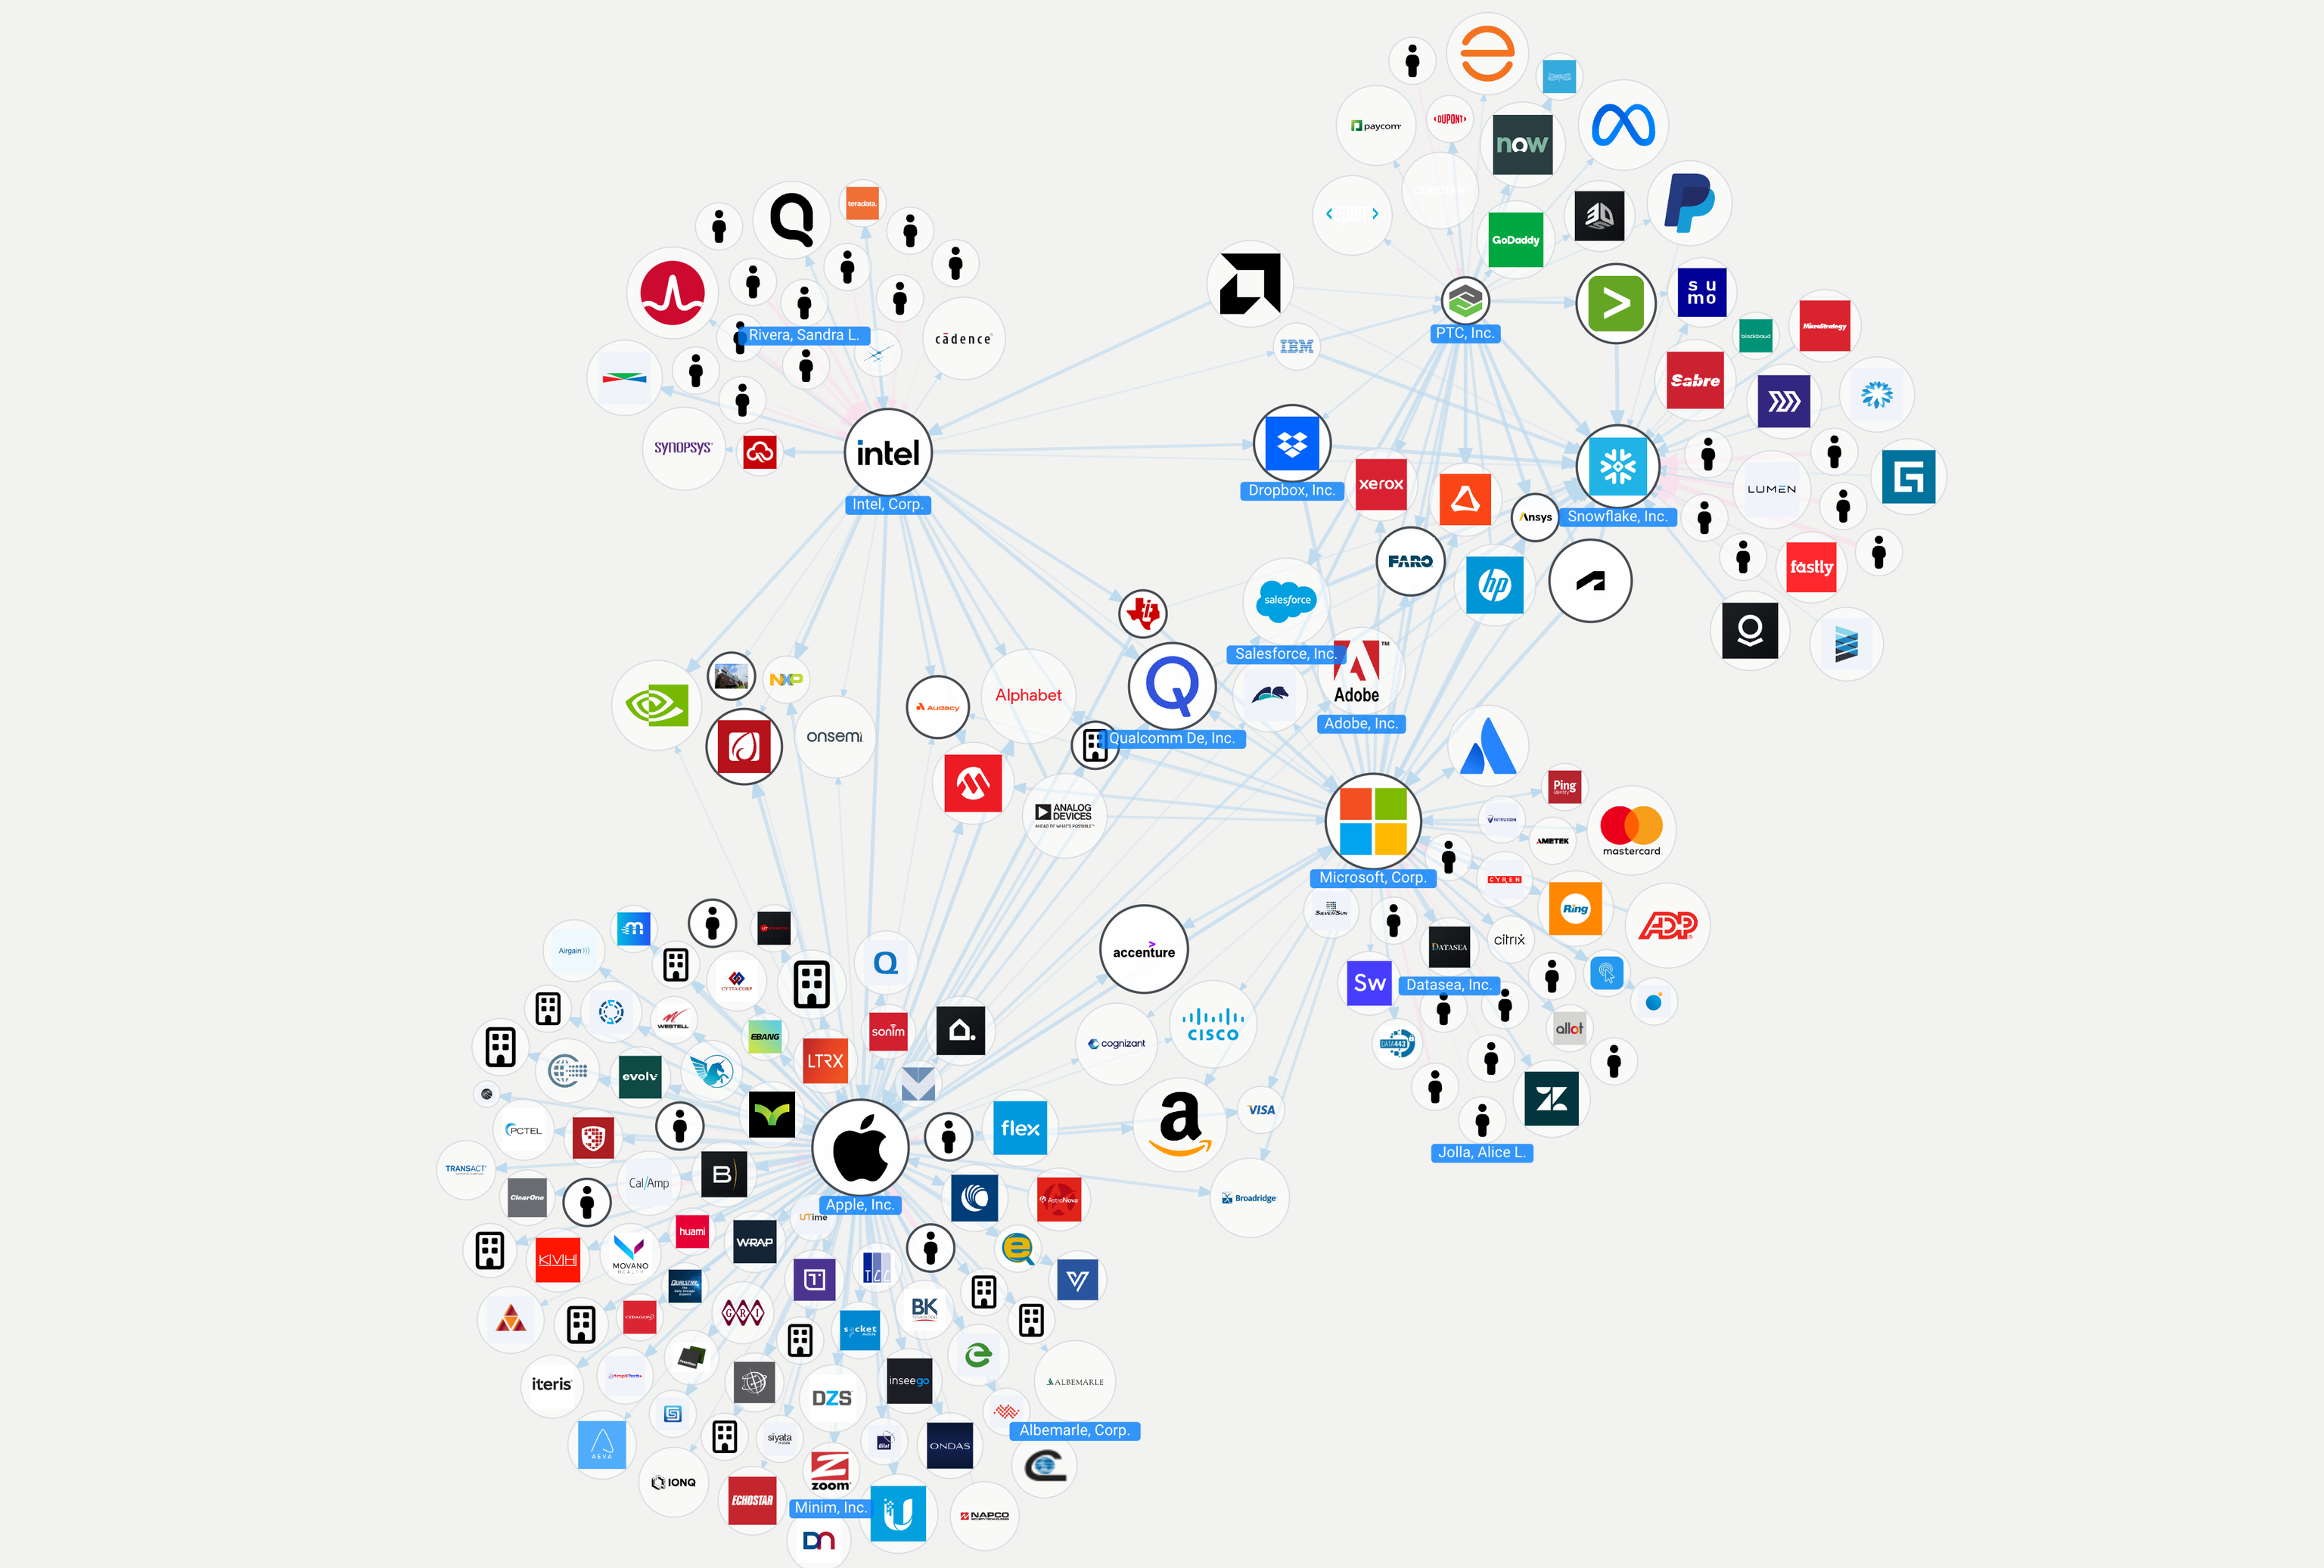
Knowledge Graph
Understanding complex relationships can be a daunting task, but with our interactive tool, you can easily explore and unravel these connections. Our tool allows you to trace relationships and uncover previously undiscovered connections, providing valuable insights and helping you make informed decisions.
Our network connects data points on multiple levels, providing you with information on holdings, ownership, decision-makers, and correlations.
Complex relationships can be explored interactively in this way.
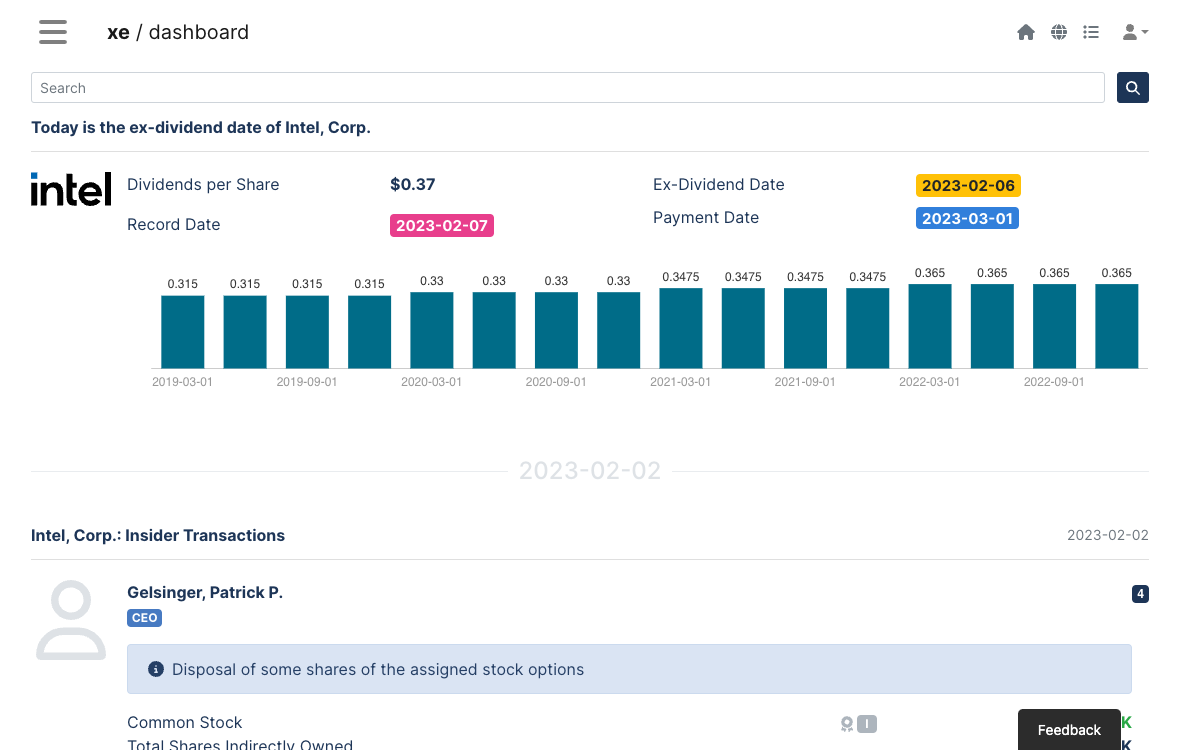
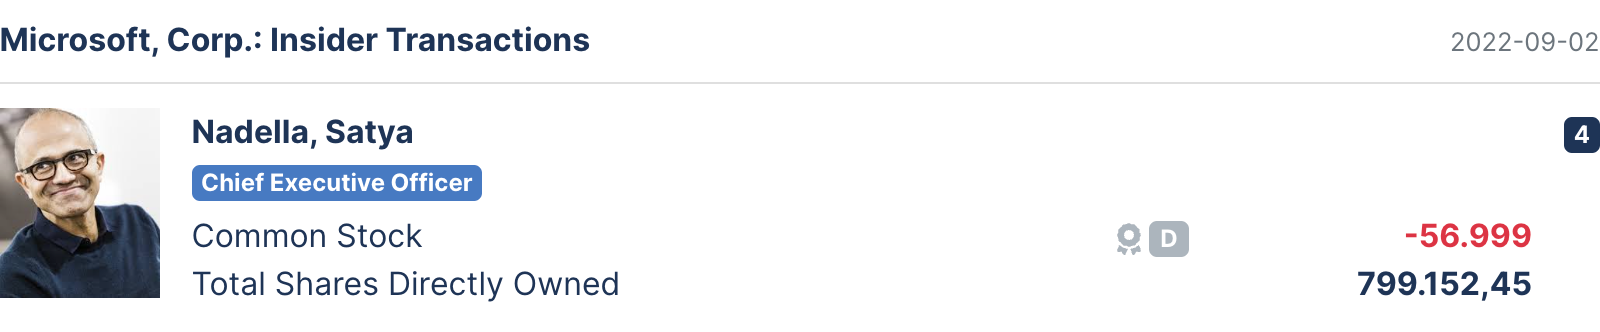
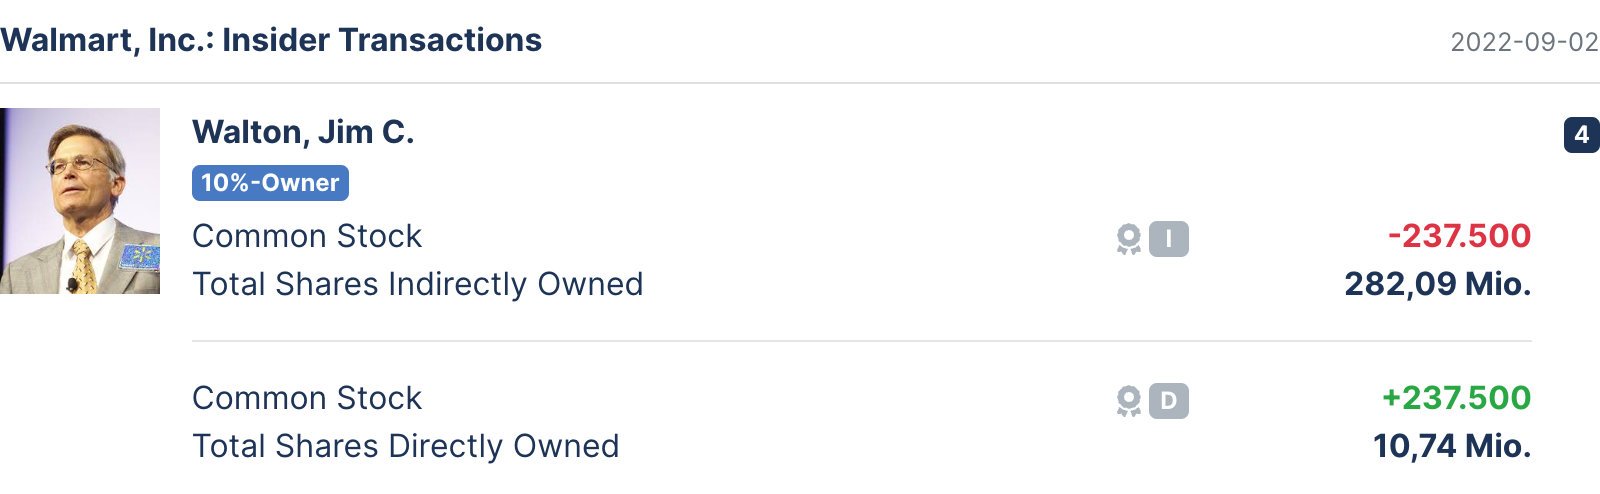
Holdings, Ownership & Insiders
Uncover ownership and track insider transactions of your companies to increase transparency and gain valuable insights.
Insider stock purchases, particularly share and stock options, can indicate the expectations and sentiment of decision-makers towards the company's future performance.
Insider transactions can also be used to identify potential conflicts of interest.
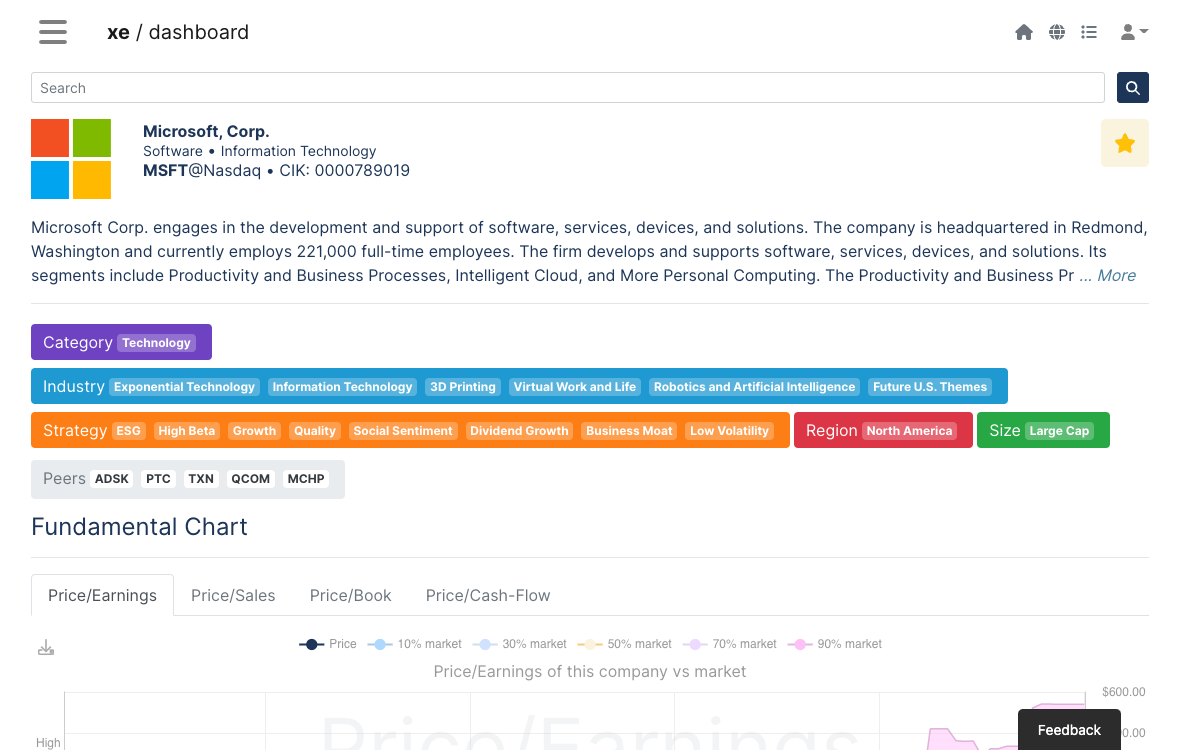
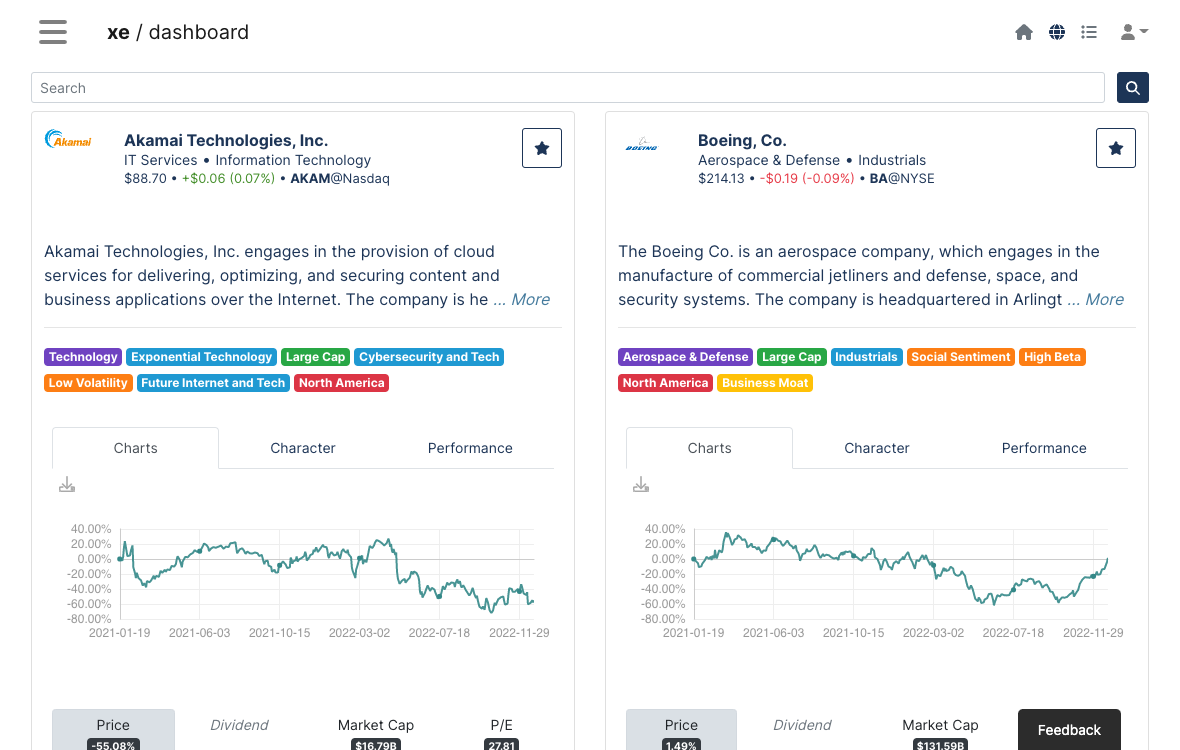
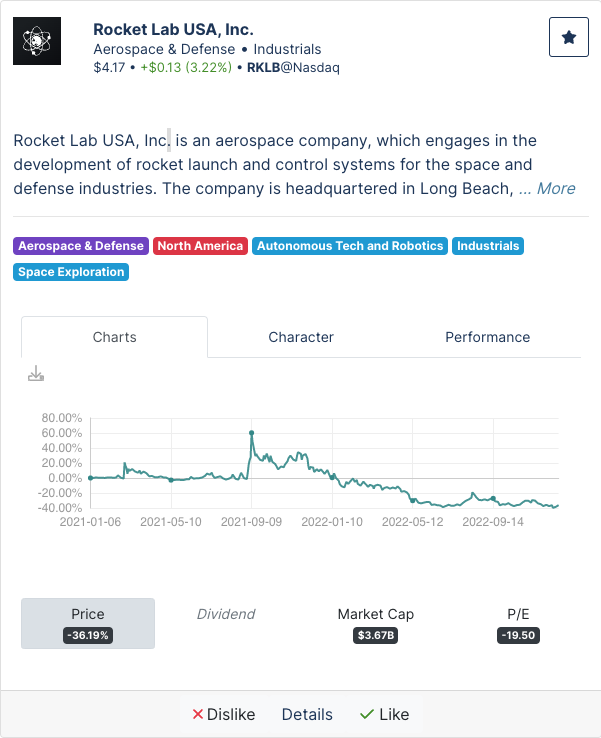
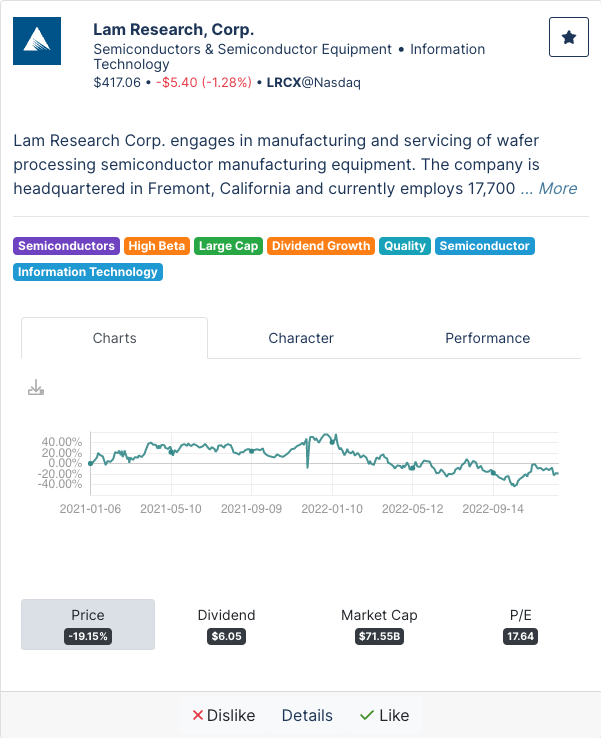
Smart Classification
The system follows professional fund managers and autonomously classifies a wide range of companies according to characteristics such as investment strategy, moated business model, momentum, innovation, dividend aristocrats, volatility and quality.
By tracking professional fund managers and categorizing companies based on characteristics such as investment strategy and innovation, you can get a sense of how these experts and industry leaders view the company and its potential. In addition, tracking and analyzing these metrics over time can help you identify trends and patterns that may not be immediately apparent, providing valuable insights into a company's performance and potential.
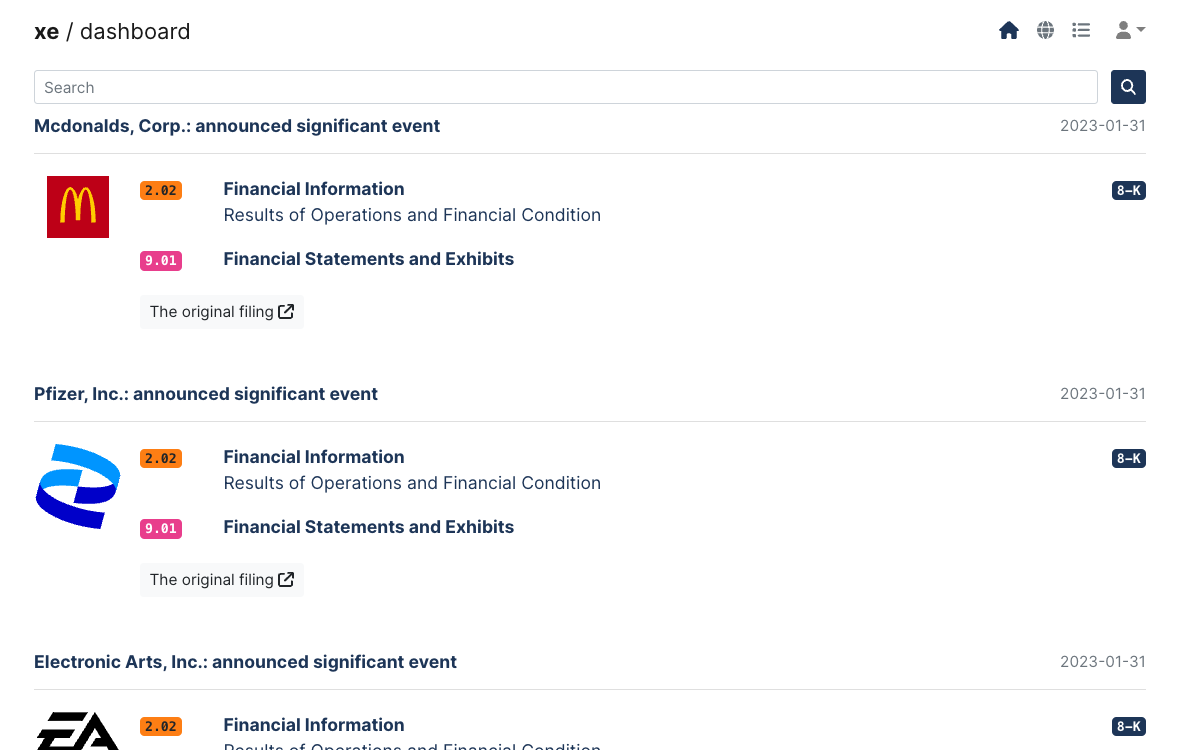
Personalized Feed
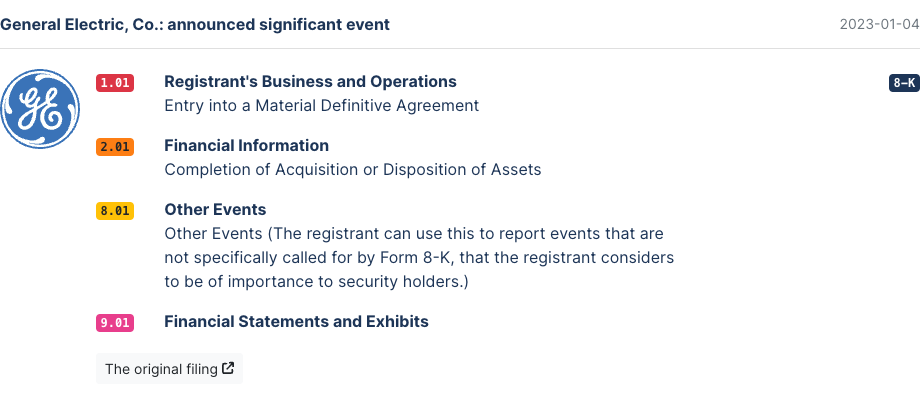
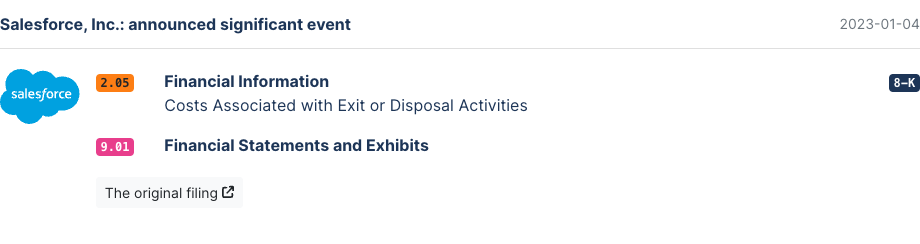
Reports, events and dates
All corporate reports are filtered by your companies, so you don't miss any business reports, profit warnings or insider transactions. In addition, we point out important macroeconomic dates that move the market.
Related Companies
Using the knowledge graph, we search for reports and events that are not directly included in your watch list but appear relevant through correlation or common holdings.
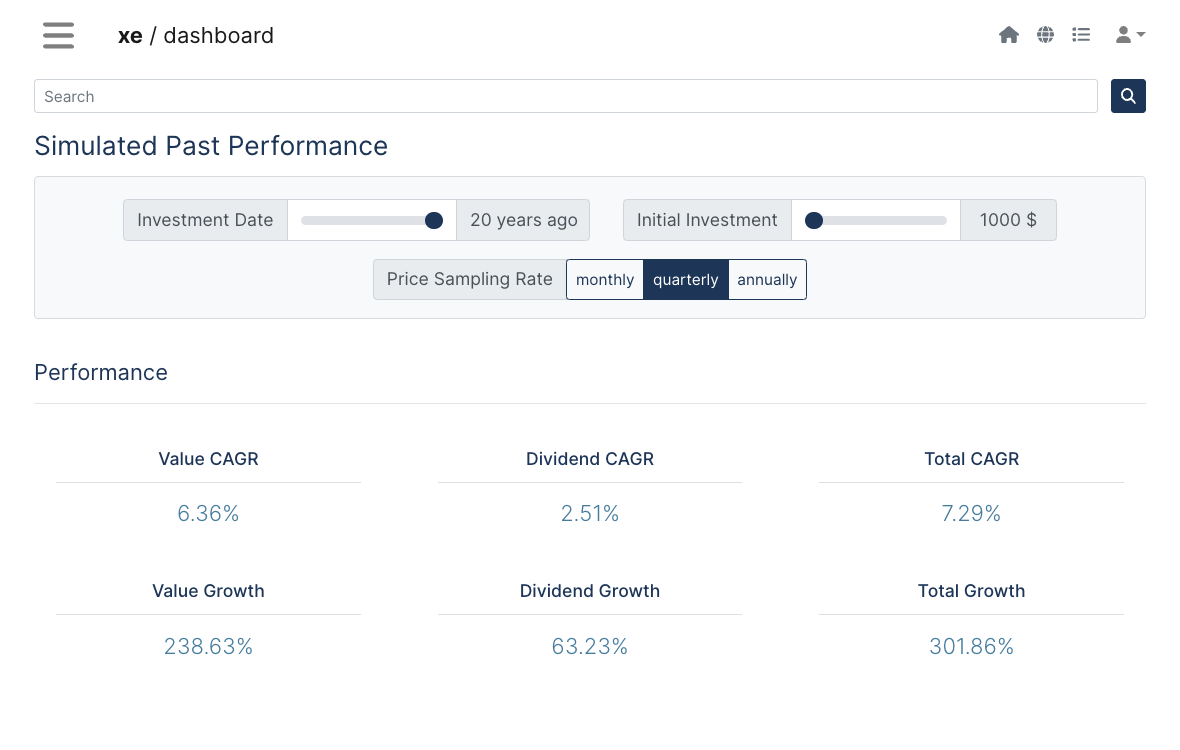
Performance Analysis
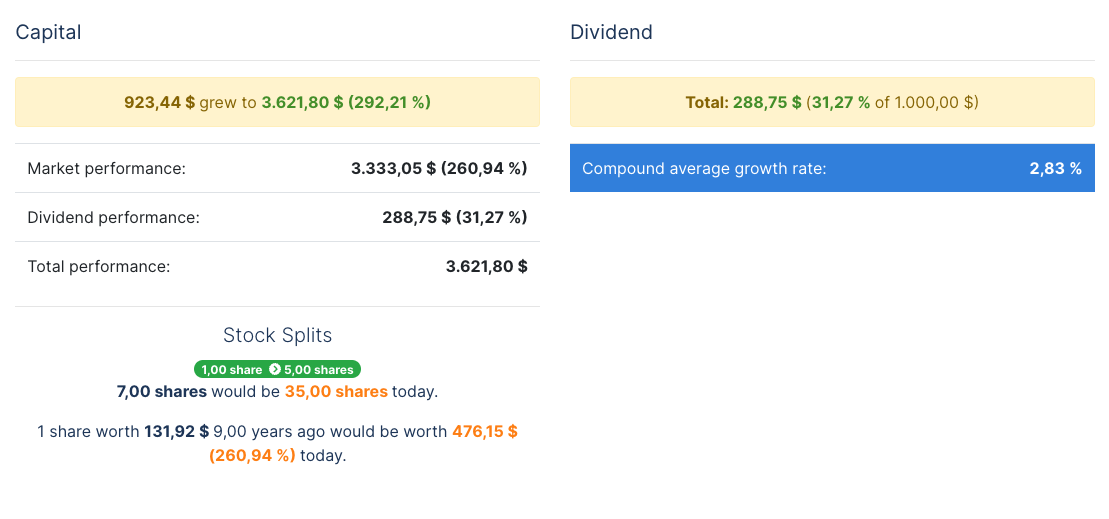
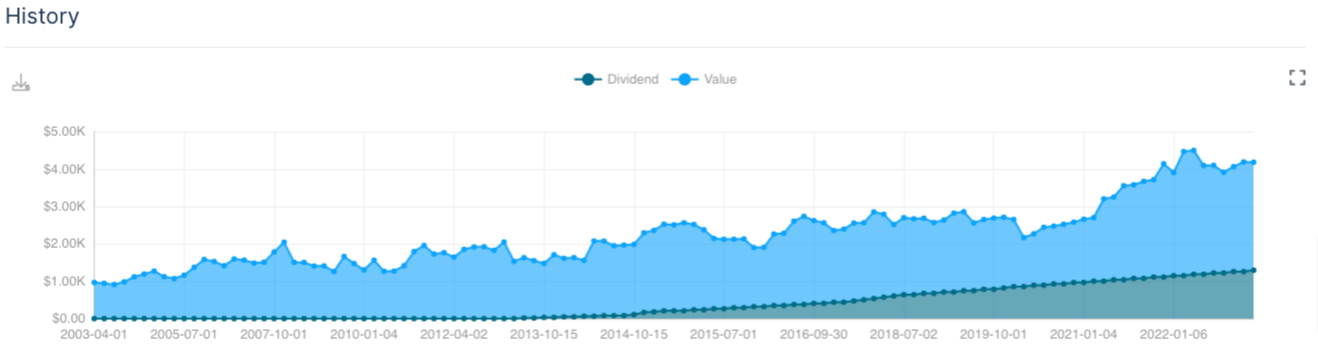
Long Term Backtest
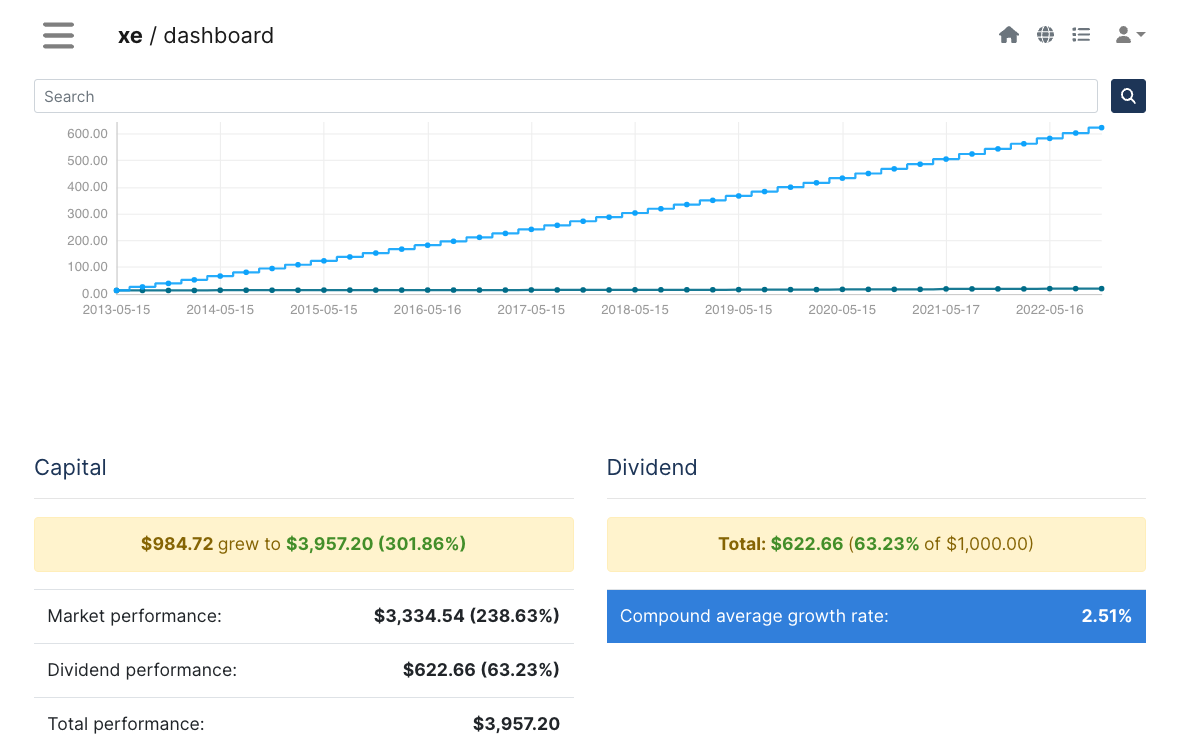
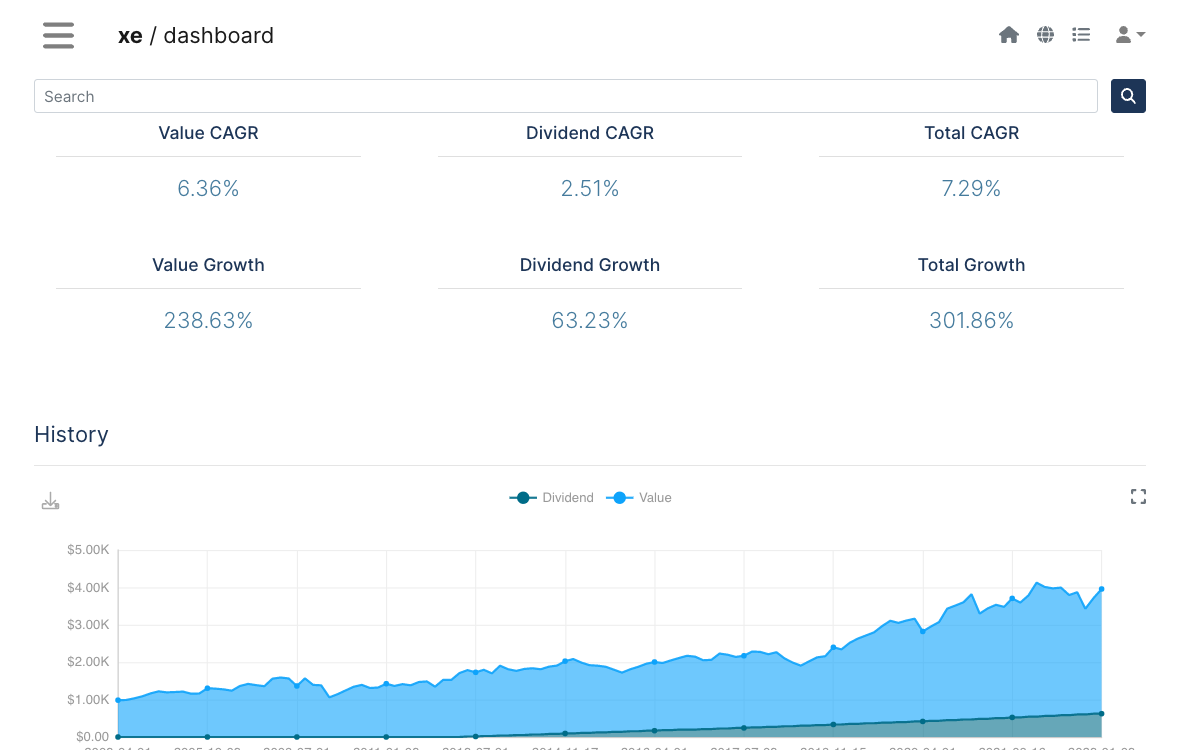
The performance charts show the share of price development and dividend payments in profit or loss over a long investment period.
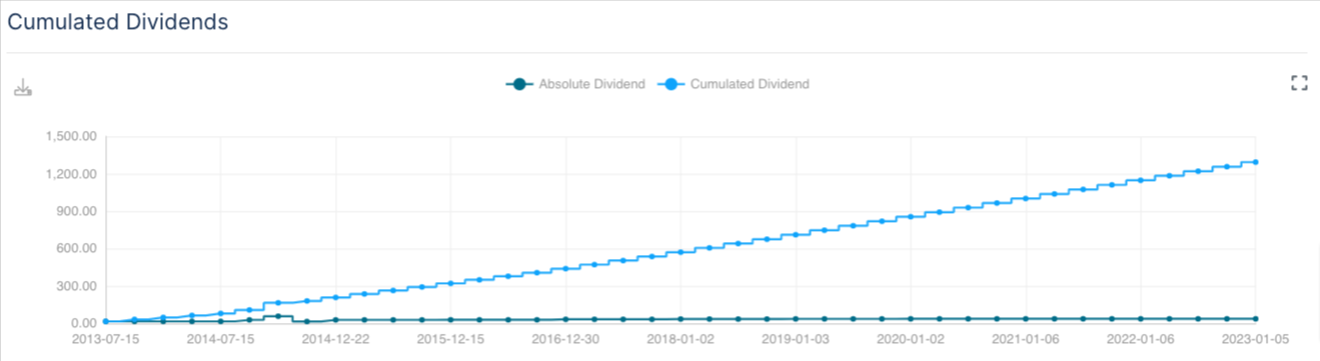
Dividends
Dividend growth rates and the return on investment are important factors, in addition to the profit payout ratio, which we map visually.
Splits
We calculate how the share price would have developed without splits.
Discovery
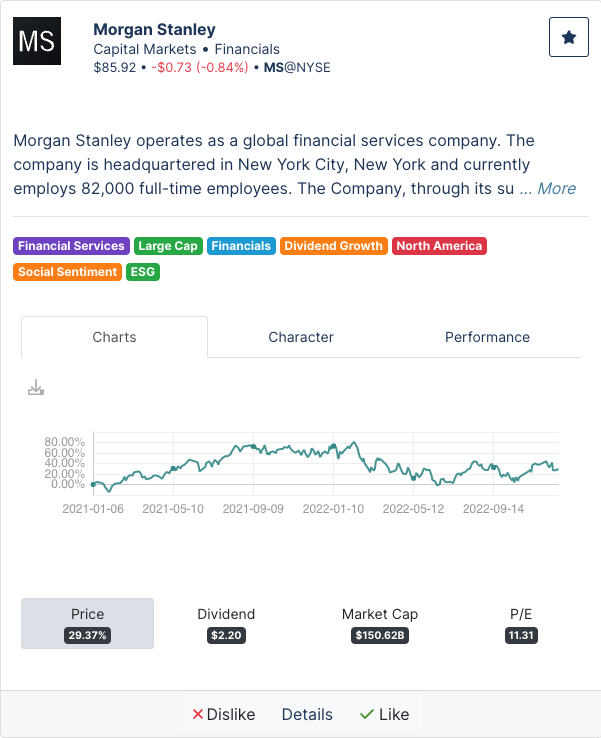
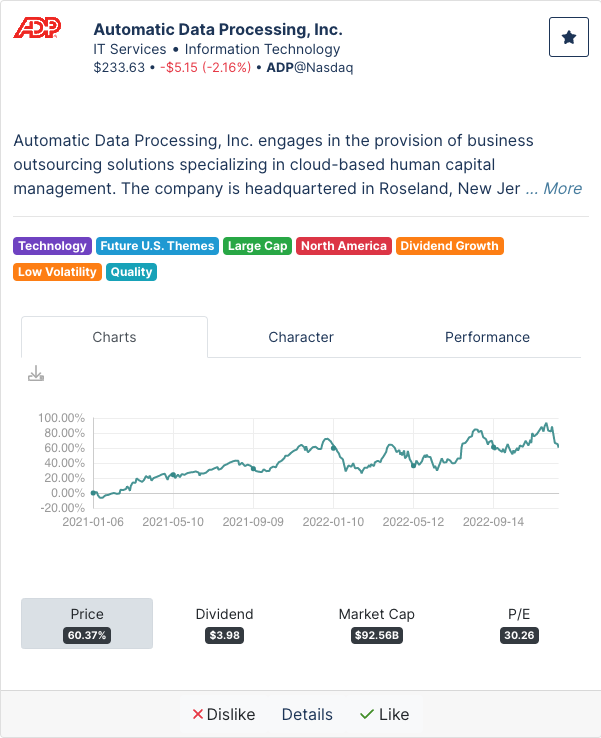
Discover new companies
We analyze the holdings held by professional investors to present companies that might interest you.
Compare companies
Discovery is designed to quickly compare company metrics.
Pricing
- AI Feed
- Smart Tags
- Fundamental Ratios
- Knowledge-Graph
- Discovery
- Financial Reports
- AI Feed
- Smart Tags
- Fundamental Ratios
- Knowledge-Graph
- Discovery
- Financial Reports
- 24/7 Support
- Invoice to your company
- Like commercial
- Individual Solutions
- White-Label Solution
- Personal Support
Contact
Contact
We appreciate your feedback.